
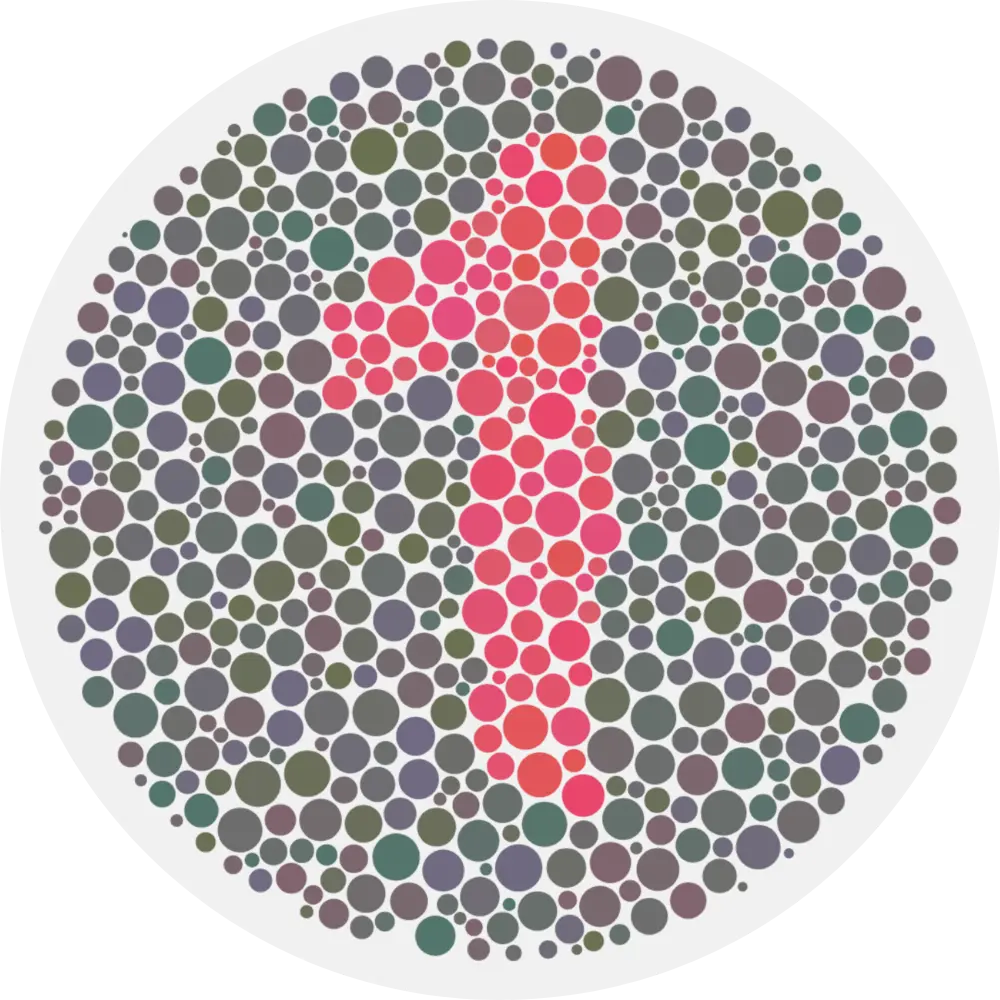
Yes. The BlindnessTest Color Blind Test is free in your browser with instant results and no sign-up required.
Color Blind Test
Take a free online color blind test that scores your red, green, and blue cone channels separately. BlindnessTest uses adaptive dot plates and cone isolation to measure how each channel performs, then suggests protan, deutan, tritan, or normal color vision when the pattern is clear.
Take the Color Blind Test
Follow the on-screen prompts to complete the screening. Your result appears as soon as you finish.
Color Blind Test
Cone isolation plates score your red, green, and blue channels. Find each hidden figure and enter what you see.
Kids Mode (Shapes)
Traditional color vision screenings, like the classic 1917 Ishihara book, rely on fixed ink pigments. While highly effective in a controlled clinical setting under calibrated daylight lamps, static plates lose accuracy on modern digital screens due to variations in display backlights, viewing angles, and subpixel configurations.
BlindnessTest takes a different route. Instead of a single pass-or-fail grade, it checks your red, green, and blue cone channels one at a time and scores each on its own. Behind the scenes this is a computer-adaptive psychophysical model, but what you experience is a set of plates that quietly adjust to how you answer.
Three interleaved adaptive staircases adjust color contrast along specific confusion axes based on your real-time inputs. Correct answers prompt the system to drop contrast closer to your visual threshold. Incorrect answers broaden the contrast steps to estimate performance on each channel. Quick depth uses eight contrast steps per channel. Detailed depth uses 128 steps for a finer estimate.
If you have only used Ishihara plates before, this goes further. Ishihara is a trusted red-green screen, but it was never designed to score each channel on its own. Choose Quick or Detailed depth with the start buttons on the welcome screen, review test settings explained for timer and format options, or read what your cone scores mean after you finish.
How Does the Color Blind Test Work?
Color vision depends on three cone types in the retina that respond to long (red), medium (green), and short (blue) wavelengths. The brain combines their signals into opponent pathways, including red-green and blue-yellow. When two cone types overlap in sensitivity, those opponent signals weaken and certain hues look muddy, grey, or similar.
This test uses cone isolation: each plate changes color mainly along one cone axis at a time. An adaptive staircase raises or lowers contrast based on your answers until it estimates a score from 0 to 100 for that channel. Three staircases run in rotation, one for red, one for green, and one for blue. Correct answers make the next plate on that axis slightly harder. Incorrect answers or missed figures make it easier.
When all three channels finish, the summary compares your scores against the rules in the scoring table under What Your Cone Scores Mean. A wrong answer on the opening check plate, repeated timeouts, inconsistent answers, or borderline score patterns can pause the run or return an inconclusive result instead of a clear type label.
Test Settings Explained
Time per plate
Choose 5, 10, 15, or 20 seconds per plate, or turn the timer off for self-paced answers. When time expires, the run pauses so you can continue or start over rather than moving on automatically. Default is 10 seconds.
Answer format
Numbers mode uses digits 1 through 9. The Kids Mode toggle on the welcome screen switches to rectangles, circles, and triangles instead, which helps children or anyone who prefers not to read numerals. Format is locked once the test starts.
Test depth
Depth is set by the start buttons on the welcome screen, not in Settings. Start Quick Test uses eight contrast divisions per channel and finishes sooner. Start Detailed Test uses 128 divisions for a finer estimate along each axis. Depth is locked after the test starts.
Progress
Show displays a progress percentage in the top bar while plates run. Hide removes it for a cleaner view. Progress reflects how far the adaptive staircases have converged, not a grade.
Plate background
White uses a light surround behind the plates. Black uses a dark surround, which some users prefer in dim rooms. Open Settings on the welcome screen to change it before you start.
Saved preferences
Your choices persist in local browser storage, so the next visit remembers timer, format, depth, progress, and background settings on the same device.
How to Prepare for Your Online Color Vision Screening
Cone isolation plates respond to how your screen renders color. These steps help your red, green, and blue scores stay consistent from run to run. Open Settings on the welcome screen to set your timer, use the Kids Mode toggle if you prefer shapes over numbers, then choose Start Quick Test or Start Detailed Test for depth before you begin.
- Set screen brightness to 100% before you start. Dim screens compress contrast steps and can shift channel scores.
- Turn off night mode, True Tone, blue-light filters, and color-correction or accessibility tint apps on your device.
- Remove tinted or colored lenses before you start. Clear everyday prescription glasses are fine if you normally wear them.
- Use your best-quality display when possible. Phone, tablet, and monitor results can differ slightly between devices.
- Sit in even indoor light and finish the full test in one sitting. Do not switch phones, tablets, or monitors mid-run.
- View each plate straight-on at about arm's length. Avoid glare on the display and do not tilt the screen.
What Your Cone Scores Mean
Your result includes a percentage for each color channel (red, green, and blue cones) and a suggested type when the score pattern is clear. When protan, deutan, or tritan is suggested, the result modal also shows a Mild, Moderate, or Strong band on the weakest channel. Normal results show a Typical range badge instead. This is screening output, not a clinical diagnosis.
Each percentage estimates how close that channel is to typical functioning on this test. When protan, deutan, or tritan is suggested, the result modal labels severity from the lowest channel score: Mild (60, 89%), Moderate (30, 59%), or Strong (below 30%). That band is a screening estimate. It does not name protanomaly vs. protanopia or deuteranomaly vs. deuteranopia.
The result modal also shows a combined accuracy percentage. That number is the average of your three channel scores, displayed below the type label. It is a quick summary, not a separate clinical metric. Read the red, green, and blue rings individually for the full picture.
Scoring below 100% on more than one channel does not automatically mean multiple defective cones. Your brain combines signals from all three types, which can make non-defective channels look slightly lower as well. A score near 0% on one channel may indicate very severe loss on that axis or, in rare cases, dichromacy.
Retaking the test often shifts scores by roughly 10 to 15 points. Larger swings usually mean brightness, filters, or device differences. Blue channel scores can also read lower with normal aging of the eye.
If no channel is clearly lowest by more than ten points and not all three reach 90%, the result modal may show an inconclusive pattern with your channel percentages but no type label. Retake in stable conditions or discuss the scores with an eye care professional.
Consult an optometrist or ophthalmologist to confirm type and severity, especially before career, licensing, or treatment decisions. You can also compare your result with the Ishihara Test or Cambridge Color Test if you want a second method.
How type suggestions are calculated on this test
| Detected variance | Channel performance rule | Common visual impact |
|---|---|---|
| Normal color vision | All channels (Red, Green, Blue) score 90% or higher | Typical trichromatic hue discrimination across the visible spectrum on this screening test. |
| Protan (red weakness) | Red channel falls more than 10 points below Green and Blue | Reds may look dimmer or darker; common red-green confusion on traffic signals, charts, and clothing. |
| Deutan (green weakness) | Green channel falls more than 10 points below Red and Blue | Muted green discrimination; confusion between pastels, browns, pinks, greys, and certain blues. |
| Tritan (blue weakness) | Blue channel falls more than 10 points below Red and Green | Blue-green and yellow-violet confusion; difficulty separating some blues from greens or yellows from violets. |
The Main Types of Color Vision Deficiencies
Color blindness is rarely a world of pure black and white. It is typically an issue of overlapping spectral sensitivities caused by genetic variations in the opsin proteins within your retina. Inherited color vision deficiency affects roughly 1 in 12 men and about 1 in 200 women, and the great majority of those cases fall on the red-green axis.
Color vision deficiency cannot be cured. Some tinted lenses may change how certain colors appear in daily life, but they do not restore normal trichromacy. Remove strong tints before testing so your scores reflect the plates on screen. Drag each slider below to compare normal color vision with protan, deutan, tritan, and achromatopsia simulations on scenes chosen for each pattern.
Protan Types (Red-Cone Axis)
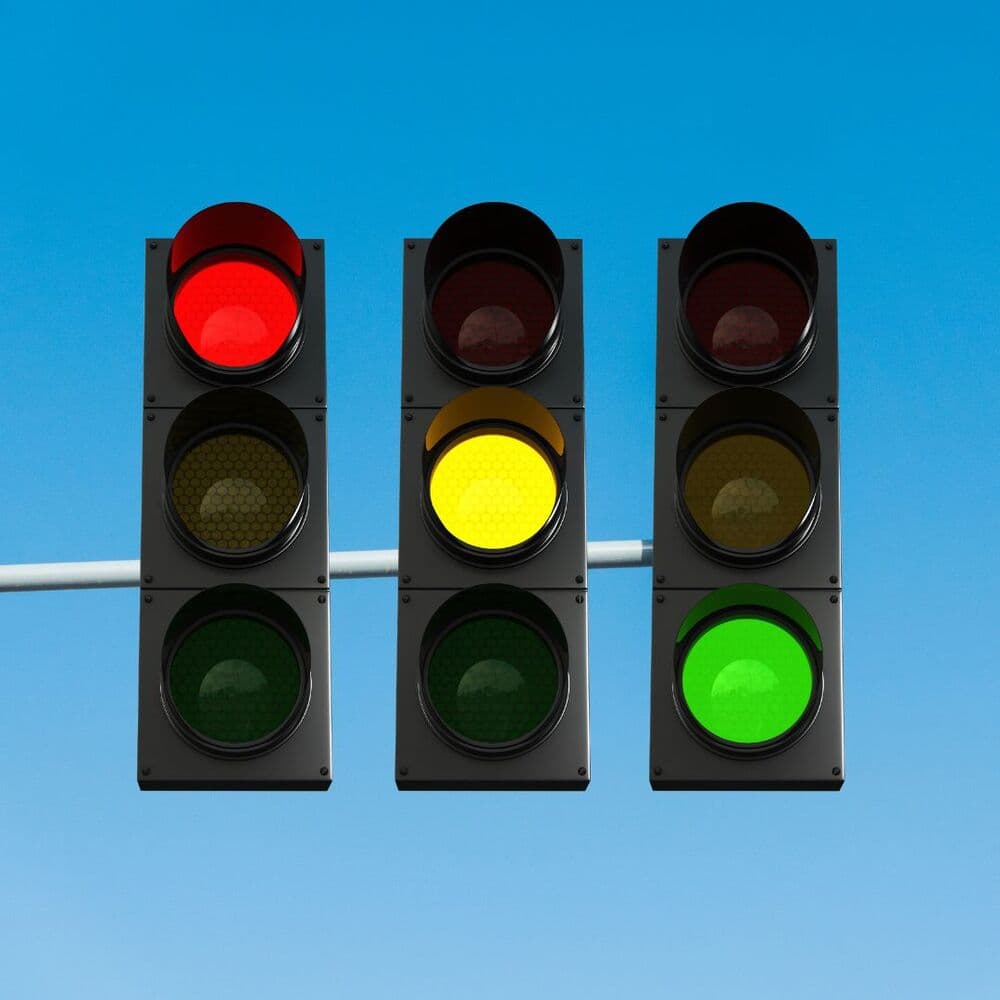
Protan patterns trace back to long-wavelength L cones. When red-sensitive opsins shift or fail, warm hues can collapse toward brown, grey, or black instead of staying visibly red. The traffic-light photo is deliberate: protan observers often lose separation on signal reds before sky blue looks much changed.
Protanomaly leaves partial red sensitivity; protanopia means those photopigments are largely absent. The everyday clue is often dimming as much as confusion. Brake lamps, chart reds on dark backgrounds, and resistor codes are common trouble spots that browser filters only partly reproduce.
If your result modal shows protan with the red ring lowest, treat it as screening output on this display. Retake with brightness at 100% and color filters off if needed, then follow up with an eye care professional for formal subtype testing.
Inherited protan patterns travel on the X chromosome, so they appear far more often in men than women. Wiring, quality control, and transport signal checks are workplace tasks where protan errors often surface first.
Deutan Types (Green-Cone Axis)

Deutan patterns are what most people mean by color blind. They involve M cones on the green axis, are the most common inherited red-green form, and are passed on the X chromosome. Ishihara plates screen this axis well, but cone isolation scores the green channel on its own.
Deuteranomaly drifts M-cone photopigments toward red wavelengths; deuteranopia means they are largely missing. Muted greens read as brown, pinks as grey, and navy as purple. In the pencil simulation, red and green casings move closer in hue while cooler blues stay more stable.
A lower green channel percentage describes this run on your display, not deuteranomaly versus deuteranopia. Compare attempts on the same phone or monitor with stable settings when tracking change over time, and book a comprehensive eye exam before occupational or licensing decisions.
Worldwide, deutan patterns account for most congenital color vision deficiency cases. Because this test isolates green input, a deutan pattern can register even when classic Ishihara plates on the same screen feel inconclusive.
Tritan Types (Blue-Cone Axis)
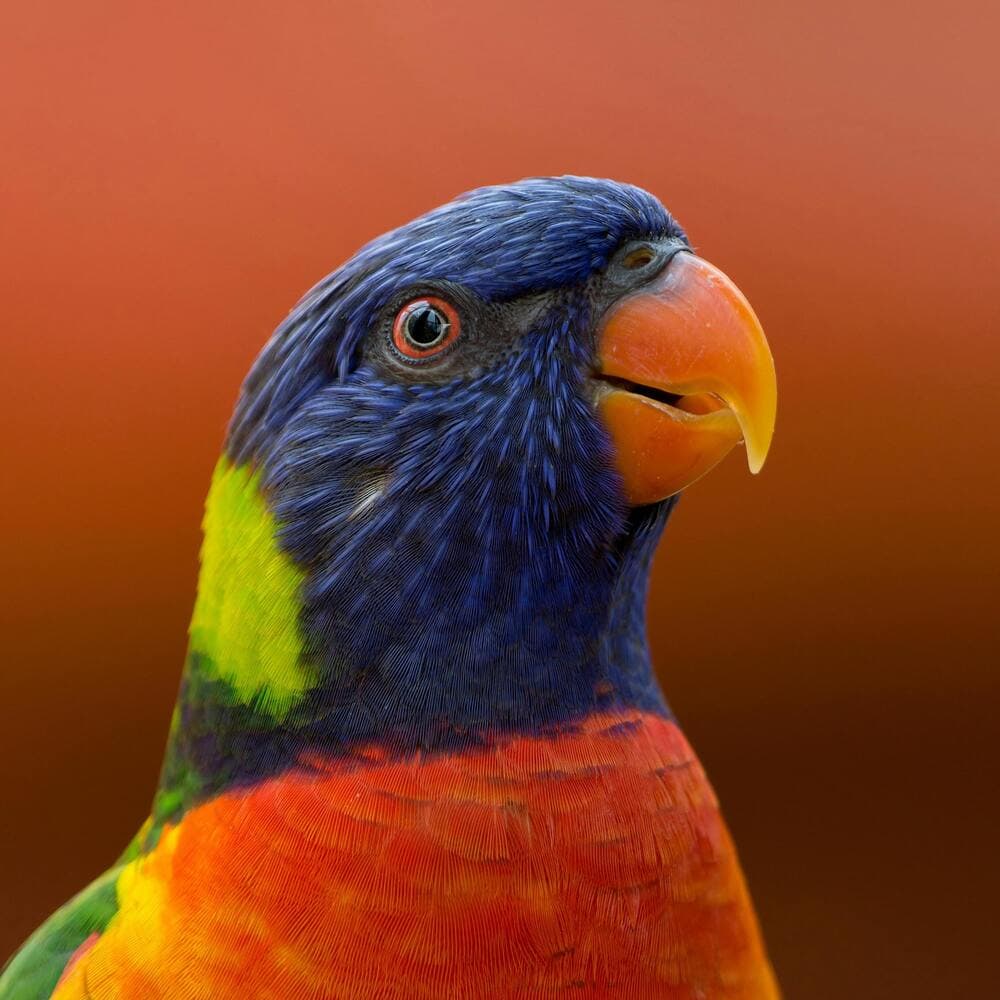
Tritan patterns involve S cones on the blue-yellow opponent pathway. They are uncommon next to red-green inheritance, can be congenital on chromosome 7, or acquired when medication, optic nerve disease, or lens changes alter short-wave input.
Tritanomaly keeps partial S-cone function; tritanopia means severe loss along that axis. The loriini bird photo places blue and yellow feathers side by side where confusion often starts, while red-green regions in the same frame change less under the filter.
Healthy aging can lower blue-channel scores when the crystalline lens yellows. Cataracts and glaucoma belong in the same conversation. If blue-yellow tasks feel newly difficult, schedule a full eye health visit rather than relying on this screening score alone.
Congenital tritan patterns are rare enough that many clinicians see them mainly through acquired causes. Designers, artists, and pilots often notice tritan shifts when pastel blues and yellows lose separation. Channel scoring here flags the blue axis even when red-green Ishihara plates on the same display look normal.
Complete Color Blindness (Achromatopsia)

Achromatopsia sits outside the protan, deutan, and tritan families. Cone photoreceptors function poorly or not at all, so vision leans on rod cells and colorful scenes can look largely grey. The balloon slider shows how little hue may remain, not every symptom of the condition.
Rod monochromacy pairs that grey world with photophobia, nystagmus, and reduced visual acuity. None of those appear in a still image filter. Common red-green or blue-yellow deficiency still leaves at least two cone pathways carrying hue information.
BlindnessTest reports protan, deutan, or tritan from separate channel results and is not validated for achromatopsia. Very low scores on all three channels may reflect setup issues or missed plates as often as severe cone loss. Suspected complete color blindness warrants ophthalmology review.
Complete cone dysfunction is uncommon and is often diagnosed in childhood through light aversion and poor acuity. If all three channel scores stay very low after careful retakes, treat that pattern as a reason for specialist referral rather than self-diagnosis.
Why the Test Checks Cones One at a Time
Typical
Protanomaly
Deuteranomaly
Tritanomaly
S coneM coneL coneWavelength (nm)
Most inherited color vision deficiency is anomalous trichromacy: all three cone types are present, but one opsin peak shifts toward its neighbor. Where two curves overlap, both cones respond similarly to the same wavelength, so a shifted peak widens that overlap.
When that overlap grows, the brain receives a weaker red-green or blue-yellow signal. That is why browns, greys, and confused reds and greens are common in daily life. Cone isolation lets this test challenge one channel at a time despite that overlap.
Because all three cone types still fire, a single pass-or-fail plate can miss a mild shift: the two healthy channels partly cover for the weak one. Isolating each channel removes that cover. When a plate drives contrast along the red axis alone, a shifted L cone has nowhere to hide, which is how a mild protan pattern can surface here even after a normal plate screen elsewhere.
Scoring Red, Green, and Blue Separately
Each channel gets its own contrast ramp
Red
Green
Blue
low contrasthigh contrast
An adaptive staircase settles on a threshold
The diagram shows the idea behind cone isolation: each color channel is challenged on its own contrast ramp, from a faint low-contrast step up to a strong one, so only one channel changes at a time. BlindnessTest does this on your screen by modulating contrast along the active red, green, or blue channel on each plate.
Each channel runs its own adaptive staircase in rotation. Quick mode divides the contrast range into eight steps per channel. Detailed mode uses 128 steps. The engine records a 0 to 100 score when the contrast bracket narrows to tolerance after consistent answers at a level.
The Science Behind Pseudoisochromatic Plates
Color carries the figure
The same plate in grayscale
Well-designed pseudoisochromatic plates encode the hidden figure in color difference, not in edges or brightness alone. The grayscale panel shows why: when only luminance remains, the numeral disappears.
BlindnessTest draws about 652 dots per plate from one of four fixed templates. The hidden figure is sampled in black, then cleared before dots are colored, so the shape is carried only in dot color along the target cone axis. Small random jitter on non-target channels reduces brightness shortcuts, following the same color-difference principle shown above rather than relying on brightness edges.
Why Your Screen Affects the Results
LCD panel
Stripe RGB subpixels, broad emission
OLED panel
Diagonal subpixels, narrow emission
Consumer displays use different panel technologies. IPS and TN LCD modules, OLED stacks, and phone subpixel layouts each emit different native spectral peaks, so the same plate may excite your cones slightly differently from one device to the next. Neither type is calibrated for your eyes out of the box, and this test runs on your uncalibrated display as an adaptive digital screener, not a clinical anomaloscope.
Set brightness near 100%, turn off Night Shift, True Tone, and blue-light filters, and remove tinted lenses during the run. Glare, dim panels, or strong OS color filters can shift scores by roughly 10 to 15 points between sessions.
Do Color Blind Glasses Actually Work?
How a notch filter reshapes light
Some tinted lenses use notch filters to block overlapping wavelength bands so certain reds and greens appear more separable in daily life. The diagram shows how specific stopbands remove light rather than changing the cones themselves.
Research shows these filters do not restore normal trichromacy or repair the underlying cone shift. Remove strong tints before testing so your scores reflect the plates on screen. BlindnessTest does not sell eyewear.
If you already own a pair, a useful experiment is to run the test twice on the same screen and settings, once with the lenses and once without. Many people find colors look more vivid through the filter while their red, green, and blue channel scores barely move, which is exactly the difference between changing appearance and changing cone function that this test is built to show.
Frequently Asked Questions
Limitations of Online Cone Isolation Screening
Screening, Not Diagnosis
Browser-based cone scores cannot replace calibrated clinical instruments, a full eye health exam, or occupational certification protocols.
Display and Environment
Monitor quality, brightness, ambient glare, and color filters can shift plate contrast and change your percentages.
Score Variability
Expect modest change between sessions. Use stable settings and the same device when comparing results over time.
Scope of the Test
This test reports channel scores and likely deficiency type. It does not assess every clinical plate set, lantern standard, or hue arrangement used in formal clinics.
Academic References & Frameworks
BlindnessTest estimates color contrast thresholds using interleaved adaptive staircases, one per cone channel. Each staircase raises or lowers plate contrast based on your answers until it reaches a stable estimate on a 0 to 100 scale. This follows the same broad psychophysical principle used in computerized color vision research: adjust stimulus difficulty from responses until a threshold is bracketed. The engine uses a deterministic staircase rather than a Bayesian QUEST or ZEST posterior model.
The references below tie peer-reviewed vision science and clinical guidance to specific parts of this screener, including cone isolation, luminance decoupling, adaptive thresholds, quantitative scoring, and responsible result language. Results still reflect performance on your uncalibrated display and do not replace calibrated in-clinic instruments such as an anomaloscope or occupational certification protocols.
- Stockman & Sharpe (2000)
The spectral sensitivities of the middle- and long-wavelength-sensitive cones derived from measurements in observers of known genotype. Vision Research, 40(13), 1711–1737. Establishes 2° L, M, and S cone fundamentals. BlindnessTest isolates each channel and shifts contrast along separate wavelength axes for independent scoring.
- Wyszecki & Stiles (1982)
Color Science: Concepts and Methods, Quantitative Data and Formulae (2nd Edition). New York: John Wiley & Sons. Core reference for colorimetry, chromaticity coordinates, and uniform color spaces. BlindnessTest maps cone-opponent contrast steps into monitor RGB using standard transforms in this tradition.
- Regan, Reffin & Mollon (1994)
Luminance noise and the rapid determination of discrimination ellipses in color deficiency. Vision Research, 34(10), 1279–1299. PMID: 8023437. Shows luminance control is needed so observers cannot read plates from brightness cues alone. BlindnessTest uses channel jitter on non-target cones to favor chromatic over lightness shortcuts.
- Cornsweet (1962)
The staircase-method in psychophysics. The American Journal of Psychology, 75(3), 485–491. Defines the up-down staircase for bracketing sensory thresholds. BlindnessTest runs three interleaved loops, tightening contrast on correct answers and widening on misses, to reach a 0–100 score per channel.
- Birch (1997)
Efficiency of the Ishihara test for identifying red-green color deficiency. Ophthalmic and Physiological Optics, 17(5), 403–408. PMID: 9390366. Analyzes sensitivity limits of fixed printed plate books. Supports why BlindnessTest uses per-channel adaptive scoring instead of pass-or-fail reads alone.
- Vingrys & King-Smith (1988)
A quantitative scoring technique for panel tests of color vision. Investigative Ophthalmology & Visual Science, 29(1), 50–63. PMID: 3257208. Introduces quantitative panel scoring beyond simple miss counts. BlindnessTest adapts that principle to red, green, and blue percentages from adaptive staircases.
- National Eye Institute (NEI)
Overview of inherited and acquired color vision deficiency. Separates congenital red-green deficiency from acquired patterns that may need follow-up. Guides how BlindnessTest frames protan, deutan, and tritan screening labels.
- American Academy of Ophthalmology (AAO)
Patient-focused explanation of color blindness types, symptoms, and clinical care. Aligns with our disclaimers: online results screen display performance and do not replace calibrated in-clinic exams with an anomaloscope.
- NHS: Color Vision Deficiency
Guidance on red-green, blue-yellow, and complete color vision deficiency. Covers daily-life and vocational impact of color vision variation. Informs practical result summaries, not occupational certification or a formal diagnosis.
Want cone-by-cone scores?
Take the Color Blind Test for red, green, and blue channel percentages plus a likely deficiency type.